Uses & Benefits
- to make predictions that include the following.
- minimum outputs / units you must sell in order to start operating profitably.
- profitability at different output levels.
- margin of safety.
- to perform sensitivity analyses, ie to estimate the viability of different 'what if' scenarios to evaluate your ability to enter into and remain within the 'profit' zone. Specifically, you can contrast the predicted results (see previous point) for each of several scenarios based on changing one variable, like pricing.
- What if the fixed costs rose by x, or by x% every month?
- What if your variable cost per unit rose by x%?
- to set performance targets. Example(s):
- Management teams and the salesteam can be given sales targets to ensure the business remains safely within its safety margin)
- to set profit margin targets (and establish the appropriate pricing strategy by comparing profit margins of different strategies, whether skimming, etc and how the business' ability to comply with the requirements, tolerate the implications, etc).
- Profit margin analysis (previous point) implies sales pricing and costing. Consequently, in addition to examining the sales pricing stratgey, cost analysis can lead to setting or extending limits to costs (fixed and or variable costs like materials), essentially, the analysis informs whether the breakeven point is tolerable or must be risen or lowered. Common ways of lowering the breakeven point / costs include outsourcing, technology analysis & hihg-productivity upgrades, margin analysis, price analysis & changes.
- to manage 'business risk' (ie the threat of financial failure because of factors, in this case fixed costs, that lower profitability if the these factors become excessive). Example(s):
- whether through routine risk-based monitoring processes or after major events (like the pandemic), the analysis may highlight the need to find less costly ways of manufacturing, advertising and so on.
- To explain and justify proposals to team members or third parties in specific and relatable terms. To this end, all of the earlier usees are applied.
- a business plan for new ventures, new product development, new product launch, new business model and or ongoing operations.
- When applying to the bank for funding, you say, "we are expecting to breakeven after x output (while referencing the functional ways in which your operations will seek to meet the output level)."
- When applying to investors, they will know when you are going to make a profit and from what point they can expect to begin getting dividends.
Key Concepts
- Fixed Costs (FC). Fixed costs do not vary, regardless of business activity or inactivity. While fixed costs can change, their change are not related to production. Examples include rent expenses that remain at a fixed dollar amount of $1,000 monthly, insurance expenses, fixed salary expenses.
- Outputs. Outputs refer to the number of units sold.
- Variable Costs (VC). Like the name suggests, variable costs vary with how much businesses produce, ie their 'output'. This is because these costs are directly related to the production of the outputs. Examples include the cost of raw materials used in manufacturing goods, wages, transport costs.
- Revenue. Revenue refers to total, gross sales earnings. It is calculated by multiplying the sale price by the number of units sold.
The BreakEven Analysis Graph & Manual Calculations
1. Collect data for the following variables.
- Output. 1) Current output and 2) a suitable interval scale to represent different levels of output. The range should be realistic to your business and start from 0 and end at the maximum that you can produce. (Example: 0, 5, 10, 15 handmade dresses if you currently make 7 dresses; 0, 1000, 2000, 3000 pens if you currently make 2,000 units)
- Fixed Costs / FC (Example: factory space rental expenses of $2,000, IT costs)
- Variable costs / VC (Example: cost price / CP, ie the cost of making or otherwise acquiring products which includes, among other things, raw materials, 15% sales commissions)
- Sale price / SP per unit produced (Example: $20 per dress or $1 per pen).
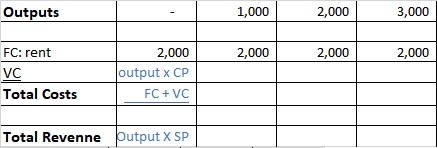
FC (rent): $2,000SP: $2.00CP: $0.50
After completing these calculations with the data above, the result should look like the following. It is not necessary to color code. However, I have used red for costs and green for revenues.

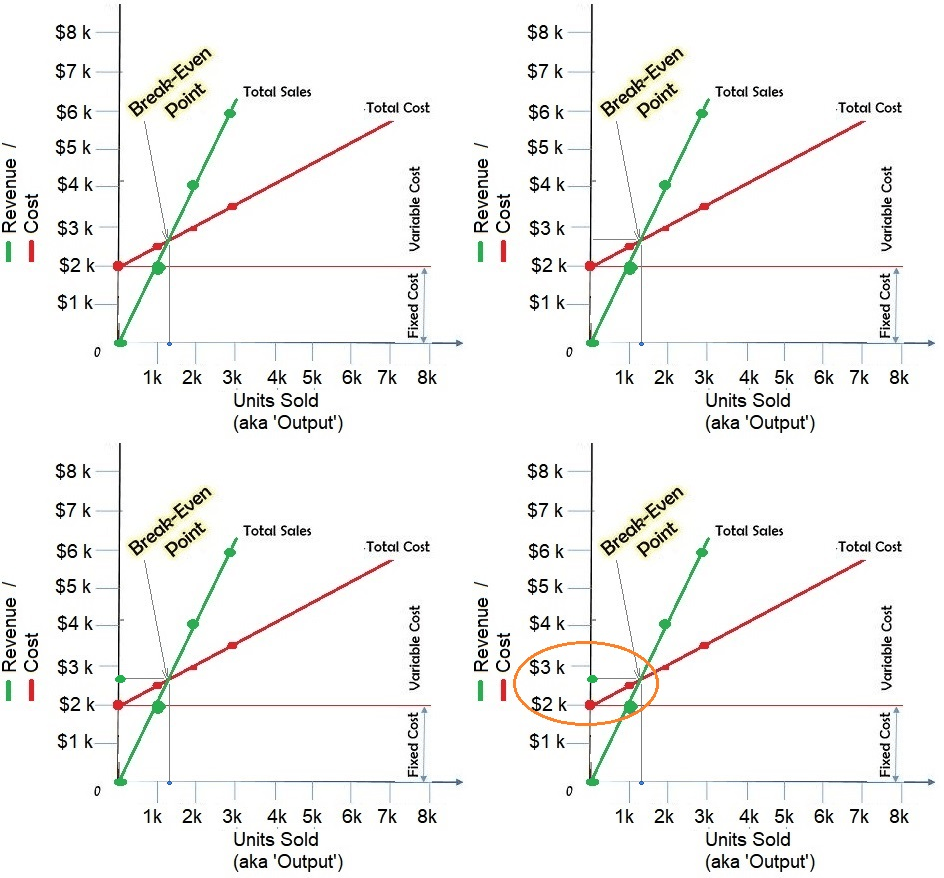
Create the plotted diagram either manually or in MS Excel. The y (horizontal) axis measures output levels in units only. Conversely, the x (vertical) axis measures dollar value. It is most notably used to plot 2 variables: 1) total revenue and 2) total costs, both in dollars. A 3rd variable may be the fixed costs.
The green line represents total revenue while the red line represents total costs. Notice how the cost line always starts above the green line, which visually demonstrates that the operation always starts at a loss where revenues are less than costs. However, the lines eventually intersect at the break even point before the revenue line continues to finally rise above the cost line. This new position visually illustrates how the venture enjoys a profit for the first time.
Notice too that 'total costs' always start from the level of the fixed costs. On that basis, fixed costs should be monitored closely because they are a measure of business risk. For this reason, businesses often stress on keeping fixed costs at a minimum (while being more permissive with variable costs).
Limitations of the breakeven analysis
While a useful tool, it is based on certain assumptions that may not always hold true. Not only should you share these assumptions but also make provisions to adddress these limitations, thereby minimizing potential risks (perhaps through strategies in your 4Ps like price skimming, well designed product mix, clever distribution channels (ie place) and so on).
- the figures are only predicted NOT actual data
- it is assumed that one price applies to your entire business and that it remains fixed.
- it assumes that you have no waste like product defects, refund requests and so on.
- it assumes that cost of sales remain the same. However, as businesses grow, they often develop economies of scale that lower unit costs (like through buying larger volumes of raw materials, economies of scale by improving technical knowledge beyond a learning curve). Conversely, costs could increase through PESTLE macroenvironmental factors like economic downturns that increase inflation and causes currency devaluations.
- it assumes that you sell only one product when most businesses have a range of products. In response, some businesses use an average price.
- the trustworthiness of its data depends heavily on the source and collection methodology.
CONTENT RELATED TO BREAK-EVEN ANALYSIS
- Break even analyses are useful in the 'Finance' section of a business plan.
- New product development
- New product launch
- When onboarding sales people, they should be familiar with their sales targets (which you can base based on breakeven analyses).
- Marginal costs and profit maximization


No comments:
Post a Comment
Note: Only a member of this blog may post a comment.